
Geochemical diagram guide
REE diagram: chondrite-normalized rare earth element patterns
An REE diagram shows the 14 rare earth elements from La to Lu divided by chondrite values on a logarithmic axis. Kaligeos normalizes your ppm data to C1 chondrite of Sun & McDonough (1989) and draws one pattern per sample.
Kaligeos Community is free for Windows 10 and 11. Your account includes 50 vector exports (SVG or PDF).
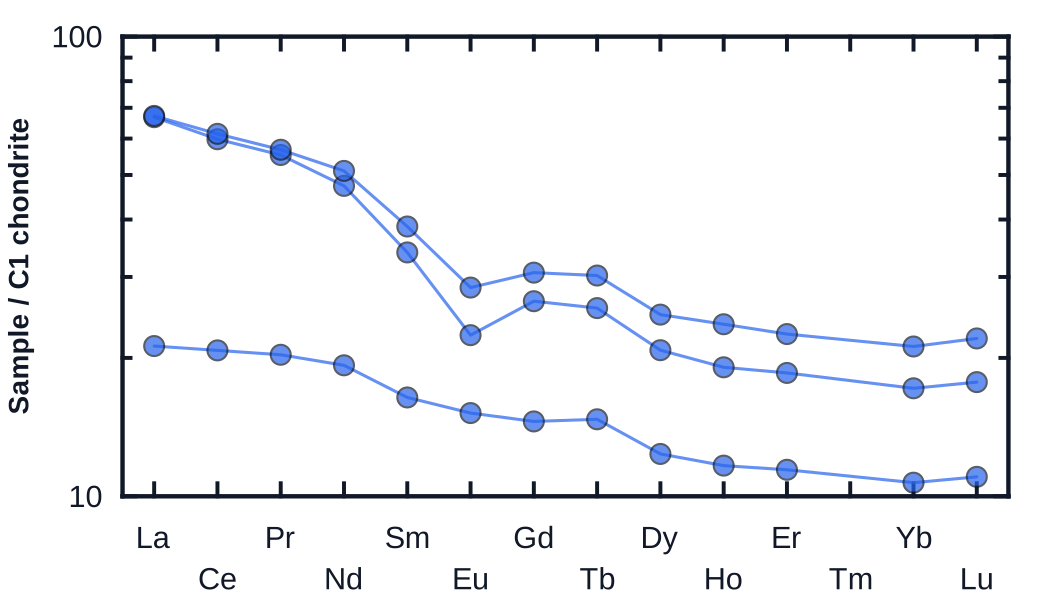
What an REE diagram shows
Dividing each rare earth element by its chondrite concentration removes the odd–even zigzag of natural abundances, so a sample becomes a smooth pattern whose shape reflects its source and history.
A steep negative slope (light REE enriched relative to heavy REE) is typical of small-degree melts or of garnet in the source; flat heavy REE suggest no residual garnet; a negative Eu anomaly usually records plagioclase fractionation or plagioclase left in the source.
Data you need
- La, Ce, Pr, Nd, Sm, Eu, Gd, Tb, Dy, Ho, Er, Tm, Yb and Lu in ppm.
- Missing or non-positive values are skipped; a sample needs at least two elements to draw a pattern.
Plotting an REE diagram in Kaligeos
- Normalization to C1 chondrite of Sun & McDonough (1989); the Y axis reads “Sample / C1 chondrite”.
- Markers, lines, logarithmic minor ticks and an option to connect patterns across missing elements.
- Automatic Y range or manual minimum and maximum on the logarithmic axis.
- Normalized ratios such as (La/Yb)c or (La/Sm)c are available in Generic XY diagrams for quantitative comparisons.
- Import CSV or Excel (.xlsx, .xlsm) tables. Kaligeos recognizes common oxide and element headers regardless of case, accents or punctuation, for example FeOt, FeO*, “La ppm” or “La (ppm)”.
- Values below detection such as “<0.5” are imported as half the limit by default; you can choose L/√2, a custom fraction or leave them empty.
- Group samples with reusable legend schemes, keep several diagrams linked to the same selection and save views inside a .kaligeos project.
- Export the figure as SVG or PDF for papers, theses and posters. Kaligeos Community includes 50 vector exports per account.
Frequently asked questions
- Which chondrite values does Kaligeos use?
- C1 chondrite from Sun & McDonough (1989). Other normalization tables are not selectable in the REE diagram at present.
- What happens if my laboratory did not report Pr, Tb or Tm?
- The missing elements are skipped. You can choose whether the line connects across the gap or breaks there.
References
- Sun, S.-s. & McDonough, W. F. (1989). Chemical and isotopic systematics of oceanic basalts: implications for mantle composition and processes. Geological Society, London, Special Publications 42, 313–345.