
Geochemical diagram guide
Pearce diagrams: Th/Yb–Nb/Yb and tectonic discrimination
Pearce diagrams use immobile trace element ratios to compare igneous rocks with tectonic settings and mantle sources. Kaligeos includes a log–log Nb/Yb vs Th/Yb diagram and templates for several classic Pearce discrimination diagrams.
Kaligeos Community is free for Windows 10 and 11. Your account includes 50 vector exports (SVG or PDF).
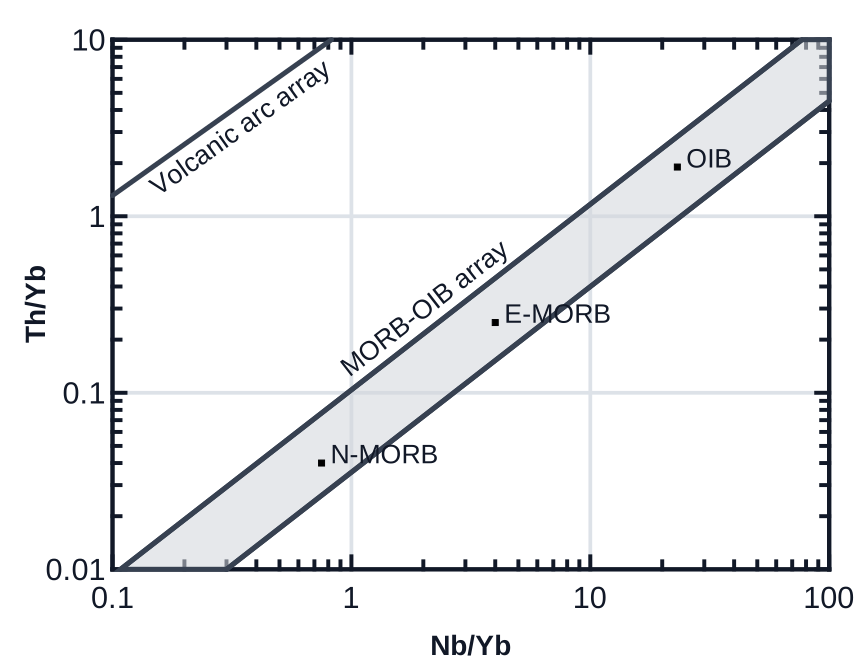
Nb/Yb vs Th/Yb
In the Th/Yb–Nb/Yb projection introduced by Pearce (2008), basalts that formed without a subduction input fall along a diagonal MORB–OIB array, from depleted N-MORB to enriched OIB. Subduction adds Th but little Nb, so arc-related rocks plot above the array; crustal contamination can produce a similar displacement.
In Kaligeos both axes are logarithmic (Nb/Yb 0.1–100 and Th/Yb 0.01–10). The template draws a MORB–OIB array band, a volcanic-arc array line and N-MORB, E-MORB and OIB reference points; each element can be shown or hidden and its labels edited. Nb, Th and Yb are read in ppm and must be positive.
Other Pearce discrimination diagrams in Kaligeos
- Pearce, Harris & Tindle (1984) granite discrimination: four log–log panels, Rb vs Y + Nb, Nb vs Y, Rb vs Yb + Ta and Ta vs Yb, with VAG, syn-COLG, WPG and ORG fields.
- Pearce & Norry (1979): Zr vs Zr/Y on log–log axes.
- Pearce & Cann (1973): Ti/100–Zr–3Y and Ti/100–Zr–Sr/2 ternary diagrams. Ti is read from a Ti column in ppm.
- Nb/Y vs Zr/Ti after Pearce (1996), with fields after Winchester & Floyd (1977).
Plotting Pearce diagrams in Kaligeos
- Import CSV or Excel (.xlsx, .xlsm) tables. Kaligeos recognizes common oxide and element headers regardless of case, accents or punctuation, for example FeOt, FeO*, “La ppm” or “La (ppm)”.
- Values below detection such as “<0.5” are imported as half the limit by default; you can choose L/√2, a custom fraction or leave them empty.
- Template labels can be moved and edited, and sample groups keep the same symbols in every diagram.
- Group samples with reusable legend schemes, keep several diagrams linked to the same selection and save views inside a .kaligeos project.
- Export the figure as SVG or PDF for papers, theses and posters. Kaligeos Community includes 50 vector exports per account.
Frequently asked questions
- Are the tectonic fields definitive?
- No discrimination diagram proves a tectonic setting. Use several diagrams, check element mobility and alteration, and interpret the results together with geological context.
- Can I add a discrimination diagram that Kaligeos does not include?
- Yes. The Custom XY Builder lets you recreate a published Cartesian or ternary diagram with its fields and labels and reuse it as a template.
References
- Pearce, J. A. (2008). Geochemical fingerprinting of oceanic basalts with applications to ophiolite classification and the search for Archean oceanic crust. Lithos 100, 14–48.
- Pearce, J. A., Harris, N. B. W. & Tindle, A. G. (1984). Trace element discrimination diagrams for the tectonic interpretation of granitic rocks. Journal of Petrology 25, 956–983.
- Pearce, J. A. & Norry, M. J. (1979). Petrogenetic implications of Ti, Zr, Y, and Nb variations in volcanic rocks. Contributions to Mineralogy and Petrology 69, 33–47.
- Pearce, J. A. & Cann, J. R. (1973). Tectonic setting of basic volcanic rocks determined using trace element analyses. Earth and Planetary Science Letters 19, 290–300.