
Geochemical diagram guide
Stiff diagram: major-ion patterns for water samples
A Stiff diagram turns a water analysis into a polygon: cations to the left, anions to the right, in milliequivalents per litre. Kaligeos converts your mg/L data, checks the charge balance and draws one pattern per sample for quick comparison.
Kaligeos Community is free for Windows 10 and 11. Your account includes 50 vector exports (SVG or PDF).
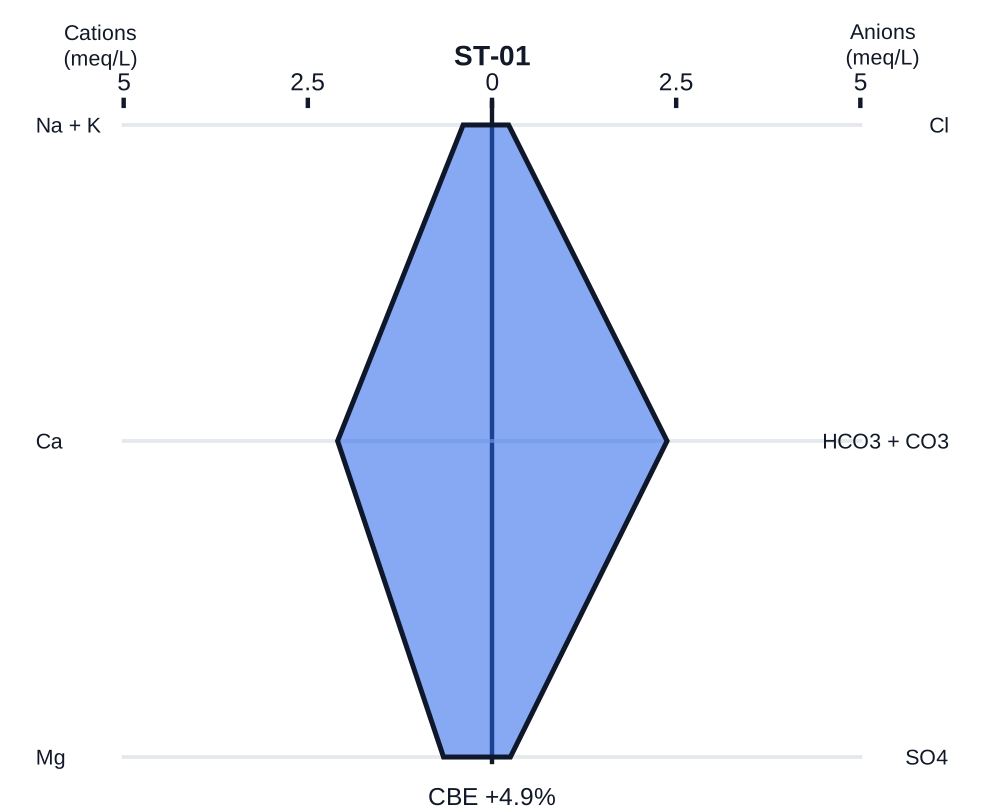
What a Stiff diagram shows
Each horizontal row pairs a cation and an anion, and the polygon width shows total ionic concentration. Waters with the same shape share a hydrochemical type, so Stiff patterns are useful on maps and in reports to compare springs, wells or monitoring points at a glance.
Data you need
- Required: Na, Ca, Mg, Cl, SO₄ and HCO₃.
- Optional: K, CO₃ and F. Missing optional ions can be treated as zero.
- Input in mg/L or meq/L. From mg/L, Kaligeos converts with meq/L = mg/L × charge ÷ molar mass; alkalinity reported as CaCO₃ is also accepted.
Plotting Stiff diagrams in Kaligeos
- Rows Na + K | Cl, Ca | HCO₃ + CO₃ and Mg | SO₄, with an alternative USGS ordering (Na + K / Cl, Mg / SO₄, Ca / HCO₃ + CO₃).
- Option to include F with Cl and a column picker for each ion.
- Charge-balance error, CBE % = 100 × (cations − anions) / (cations + anions), with a warning above 10% by default.
- Shared automatic scale or a manual half-range in meq/L so that all samples are comparable.
- Up to 12 panels per diagram, with ionic values, CBE, axes and fill colour per sample.
- Import CSV or Excel (.xlsx, .xlsm) tables. Kaligeos recognizes common oxide and element headers regardless of case, accents or punctuation, for example FeOt, FeO*, “La ppm” or “La (ppm)”.
- Export the figure as SVG or PDF for papers, theses and posters. Kaligeos Community includes 50 vector exports per account.
Frequently asked questions
- Why are Stiff diagrams drawn in meq/L instead of mg/L?
- Milliequivalents account for ionic charge, so cations and anions balance and the polygon shape reflects water type rather than the molar masses of the ions.
References
- Stiff, H. A., Jr. (1951). The interpretation of chemical water analysis by means of patterns. Journal of Petroleum Technology 3(10), 15–17. doi:10.2118/951376-G